


光纤记录系统是目前常用的神经元群体荧光信号检测工具,其特点是能通过光学技术记录特异性神经元在特定行为范式中的活性变化,可以实时观测动物在进行复杂行为时的神经投射活动,对于研究特定神经环路在不同行为范式中的功能具有重要意义。随着新型光遗传神经递质荧光探针的出现,进一步拓宽了该系统的应用范围,使之能够实时记录特定脑区中神经递质(如多巴胺,乙酰胆碱,腺苷等)在动物行为过程中的动态变化,成为在体范畴研究神经递质变化的重要工具。
410nm 有助于消除噪音干扰
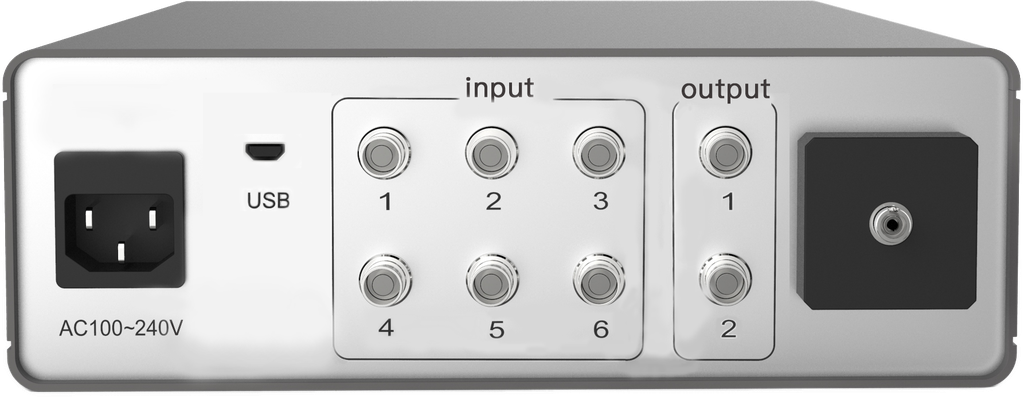
丰富的I/O接口及激发光波长选择
针对目前神经环路研究中的多核团和高通量荧光信号记录需求,inper 结合落射式荧光显微技术,多模光纤传导技术,COMS 成像技术 , 研发了新一代多通道光纤记录系统。该系统集成了稳定的 LED 光源,激发光波长 410 nm,488/560 nm;高品质光学镜片,采集光波长范围 503 - 538 nm;高灵敏度且低噪的 CMOS 芯片。在保证激发光稳定输出的前提下,能够准确采集到目标波长的荧光信号。配置功能强大的采集分析软件,支持最大 8 个数字信号打标通道,可满足行为学实验中多个事件相关的信号采集。
超稳定的LED光源
高灵敏度的CMOS芯片
高质量的滤光片
丰富的I/O接口
功能强大的采集软件
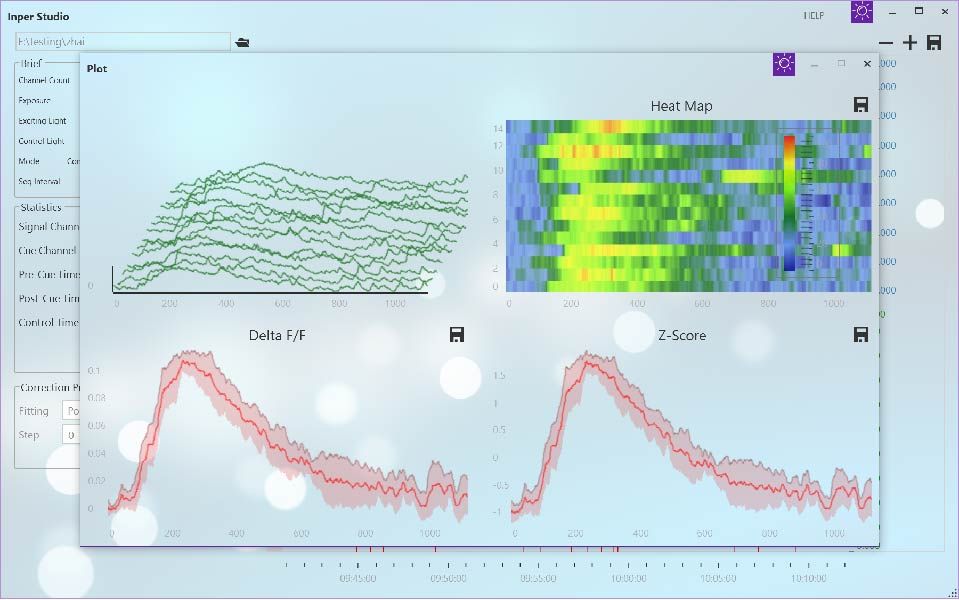
inper 多通道光纤记录系统采集软件,界面简单,易于操作,可同步采集信号和行为学事件。软件可以设置信号采样率,CMOS相机曝光时间,增益等,并且具有信号实时预览功能。
个性化定制的分析软件
无需任何编程基础,只需东东鼠标即可完成数据分析.
分析软件能直接出DeltaF/f, Heat-map, Z-score等图,也可以根据您的需求来定制。
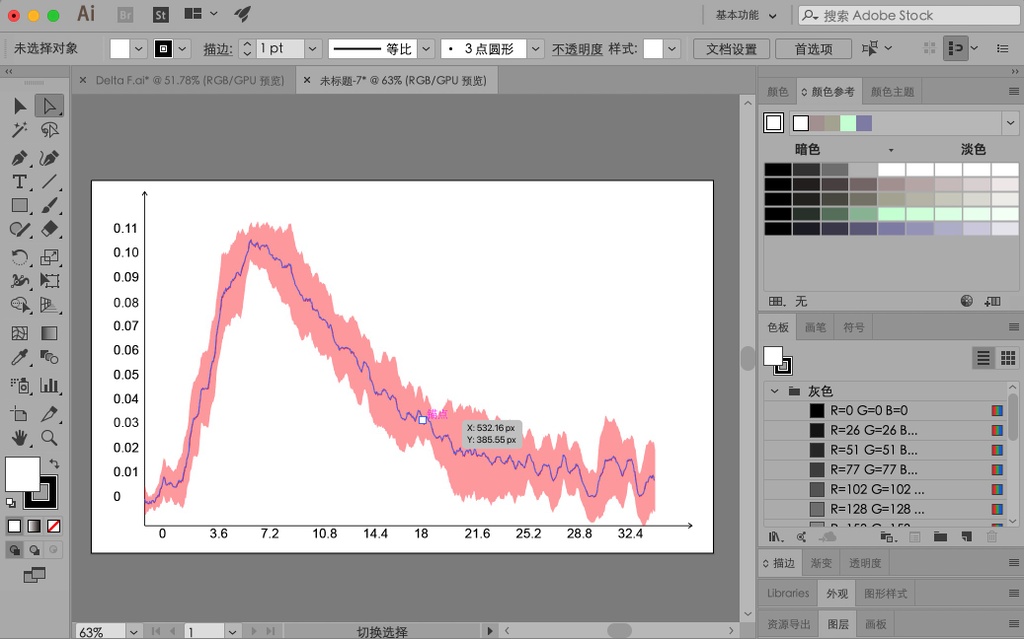
分析软件能直接导出矢量图,您可以用AI等软件编辑颜色,字体,排版等。
主要参数
1.系统采用三色设计,可同时使用405nm、470nm、580nm三种激发光对动物脑内同一核团的神经元钙信号进行实时记录;
2.系统对三个通道的激发光分别进行频率编码,以保证每个通道激发所得的荧光信号的独立性和有效性;
3.三色光纤记录系统集合了两种双色光纤记录系统(405nm&470nm以及470nm&580nm)的性能特点,同时使用上更加灵活便捷;
使用405nm和470nm通道,可将405nm的激发光激发的荧光信号作为参考信号,以排除470nm通道激发出的荧光信号的噪音,验证钙信号通道的数据有效性;此组合可用作检测新型可遗传编码的乙酰胆碱和多巴胺等探针的荧光变化,即可实时监测乙酰胆碱、多巴胺浓度的动态变化情况;
使用470nm和580nm通道,采用RGECO等红色荧光蛋白作为参考标记物,则可利用470nm通道的信号作为对照数据排除噪音干扰;
使用3个光源同时记录,可选择钙敏感荧光探针作为标记物,将405nm通道作为参考通道,对470nm和580nm通道进行信号记录,可以同时对相关脑区的两种类型神经元在某一行为范式中的活动情况进行同步记录,用以反应同一行为范式中不同类型神经元的编码特征。
二、技术参数
1.采用405nm、470nm、580nm激发光对动物脑内同一核团神经元钙信号进行记录;
2.系统对三个通道的激发光分别进行频率编码,以保证每个通道激发所得的荧光信号的独立性和有效性;
3.系统集合了两种双色光纤记录系统(405nm&470nm以及470nm&580nm)的性能特点,同时使用上更加灵活便捷;
4.使用3个光源同时记录,可选择钙敏感荧光探针作为标记物,将405nm通道作为参考通道,对470nm和580nm通道进行信号记录,可以同时对相关脑区的两种类型神经元在某一行为范式中的活动情况进行同步记录,用以反应同一行为范式中不同类型神经元的编码特征;
5.偏置噪音比 <1000;
6.含同步接口,可配合行为学软件及视频同步使用;
7.紫光激发光中心波长范围(nm)400~410
8.蓝光激发光中心波长范围(nm)460~480
9.黄光激发光中心波长范围(nm)570~590
10.光纤输出功率范围(µW)20~180;
11.软件可对荧光的△f/f值进行标准化计算,绘制出热图,线图等,可对单只或多只动物的数据进行比较分析;
12.分析软件含有matlab和c语言算法2种版本,可根据用户需要选择自定义;
13.钙信号采样频率(Hz):0~400;
14.钙信号采样通道数7(多通道可拓展至10通道);
15.钙信号检测范围(V)0~10;
16.最小有效可检测功率(pW)0.6;
17.数字信号采样频率(Hz):0~400;
18.数字信号采样通道数3;
19.低通滤波截止频率(Hz):35;
20.数字平滑窗口(sample):50;
21.基线噪声:<0.01;
22.含脑立体定位模块,可对动物的脑部进行固定,并可三维对其进行操作;
23.含体式及体温维持模块,可通过显微镜进行手术放大,并维持动物的体温;
24.可对小动物进行多通路的气体麻醉,含各种规格的面罩:能满足大小不同动物的需求,另有多个大小鼠专用面罩(特制);
25.整机质保3年。
Specifications for 光纖記錄儀
| 激發光波長(nm) | 410 or 470 or 561 or 410/470 or 410/561 or 470/561 or 410/470/561 |